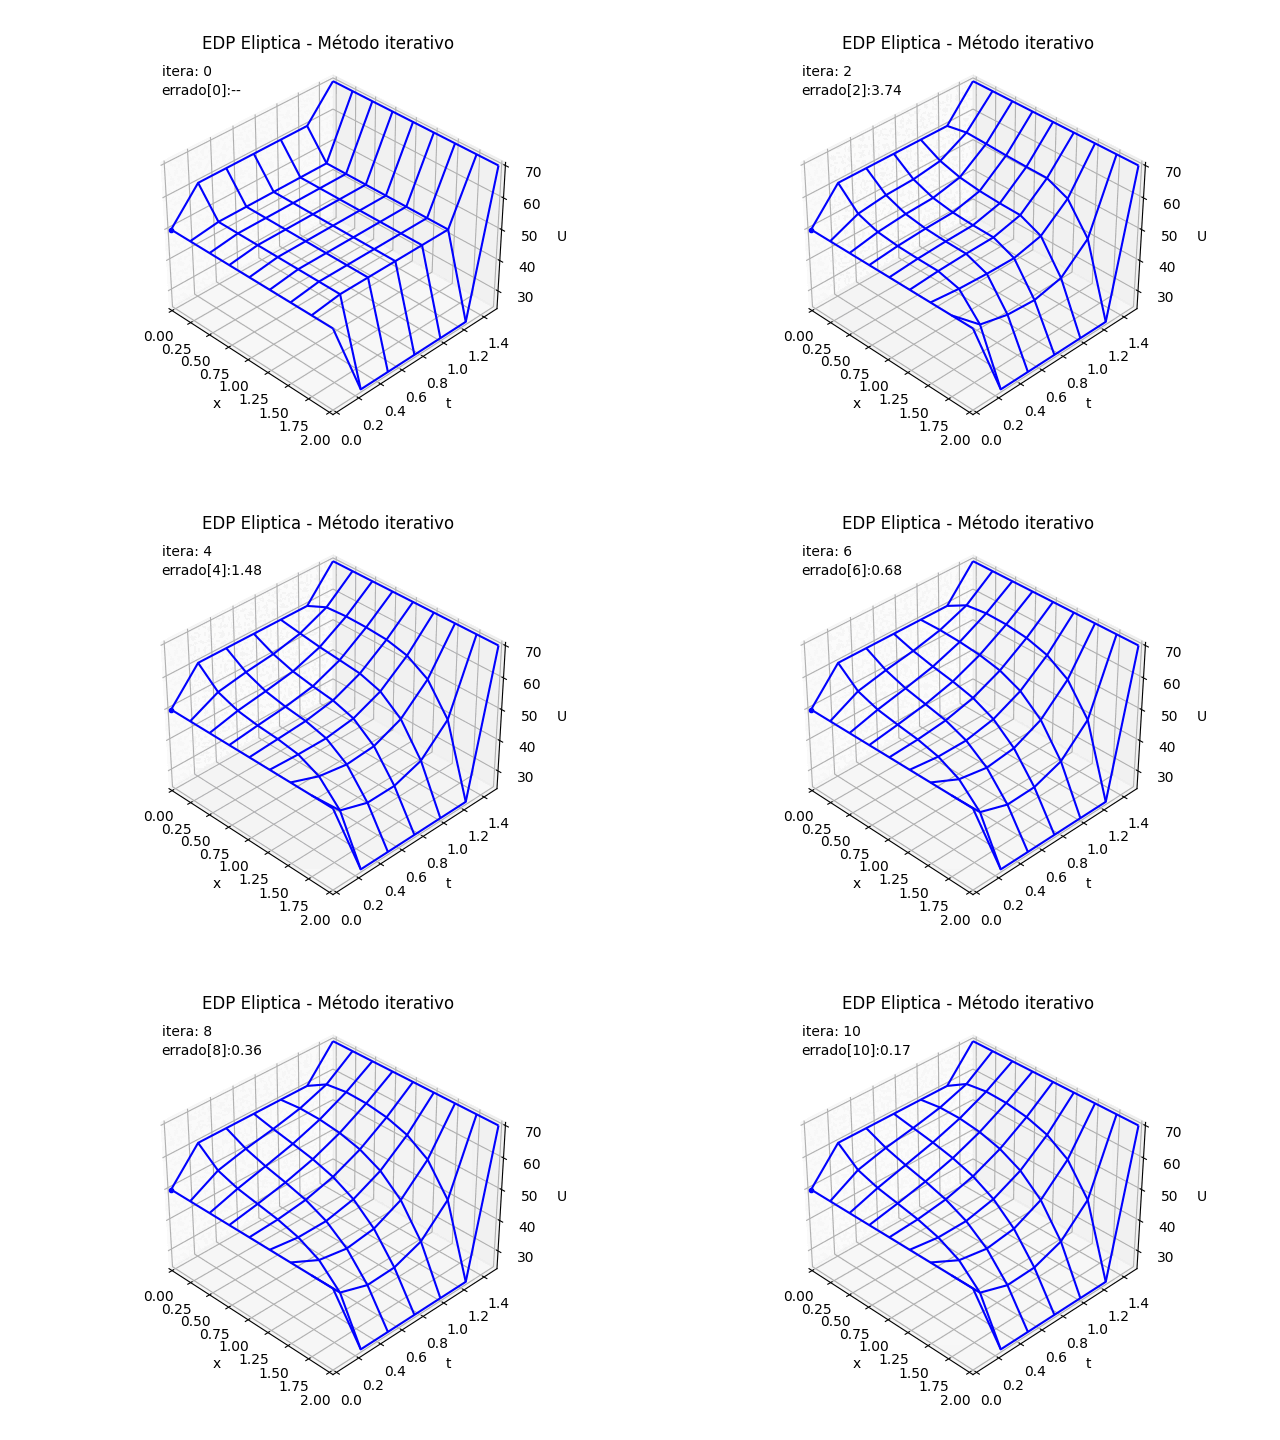
Solo para fines didácticos, y como complemento para los ejercicios presentados en la unidad para Ecuaciones Diferenciales Parciales, se presentan las instrucciones para las animaciones usadas en la presentación de los conceptos y ejercicios. Los algoritmos para animación NO son necesarios para realizar los ejercicios, que requieren una parte analítica con al menos tres iteraciones en papel y lápiz. Se lo adjunta como una herramienta didáctica de asistencia para las clases.
EDP Parabólica [ concepto ] [ ejercicio ]
1. EDP Parabólicas método explícito
Método explícito EDP Parabólica
lambda:  0.25
x: [0.  0.1 0.2 0.3 0.4 0.5 0.6 0.7 0.8 0.9 1. ]
t: [0.   0.01 0.02 0.03 0.04 0.05 0.06 0.07 0.08 0.09 0.1 ] ... 1.0
Tabla de resultados en malla EDP Parabólica
j, U[:,: 10 ], primeras iteraciones
10 [60.   48.23 38.42 31.65 27.85 26.33 26.43 27.89 30.76 34.96 40.  ]
9 [60.   47.67 37.58 30.86 27.29 25.96 26.11 27.53 30.39 34.71 40.  ]
8 [60.   47.02 36.63 30.03 26.75 25.64 25.82 27.16 29.99 34.44 40.  ]
7 [60.   46.25 35.56 29.15 26.25 25.37 25.56 26.78 29.53 34.11 40.  ]
6 [60.   45.34 34.34 28.23 25.79 25.17 25.35 26.38 29.   33.72 40.  ]
5 [60.   44.21 32.93 27.29 25.41 25.05 25.18 25.98 28.4  33.23 40.  ]
4 [60.   42.77 31.29 26.37 25.14 25.   25.06 25.59 27.7  32.62 40.  ]
3 [60.   40.86 29.38 25.55 25.   25.   25.   25.23 26.88 31.8  40.  ]
2 [60.   38.12 27.19 25.   25.   25.   25.   25.   25.94 30.62 40.  ]
1 [60.   33.75 25.   25.   25.   25.   25.   25.   25.   28.75 40.  ]
0 [60. 25. 25. 25. 25. 25. 25. 25. 25. 25. 40.]
>>>
Instrucciones en Python
# EDP parabólicas d2u/dx2  = K du/dt
# método explícito,usando diferencias divididas
# Referencia: Chapra 30.2 p.888 pdf.912, Rodriguez 10.2 p.406
import numpy as np

# INGRESO
# Valores de frontera
Ta = 60
Tb = 40
#T0 = 25 # estado inicial de barra
fx = lambda x: 25 + 0*x # función inicial para T0
a = 0  # longitud en x
b = 1

K = 4     # Constante K
dx = 0.1  # Tamaño de paso
dt = dx/10

n = 100 # iteraciones en tiempo
verdigitos = 2   # decimales a mostrar en tabla de resultados

# PROCEDIMIENTO
# iteraciones en longitud
xi = np.arange(a,b+dx,dx)
fi = fx(xi)
m = len(xi)
ultimox = m-1
ultimot = n-1
# Resultados en tabla u[x,t]
u = np.zeros(shape=(m,n+1), dtype=float)

# valores iniciales de u[:,j]
j = 0
u[0,:]= Ta
u[1:ultimox,j] = fi[1:ultimox]
u[ultimox,:] = Tb

# factores P,Q,R
lamb = dt/(K*dx**2)
P = lamb
Q = 1 - 2*lamb
R = lamb

# Calcula U para cada tiempo + dt
tj = np.arange(0,(n+1)*dt,dt)
j = 0
while not(j>ultimot): # igual con lazo for
    for i in range(1,ultimox,1):
        u[i,j+1] = P*u[i-1,j] + Q*u[i,j] + R*u[i+1,j]
    j=j+1

# SALIDA
np.set_printoptions(precision=verdigitos)
print('Método explícito EDP Parabólica')
print('lambda: ',np.around(lamb,verdigitos))
print('x:',xi)
print('t:',tj[0:len(xi)],'...',tj[-1])
print('Tabla de resultados en malla EDP Parabólica')
print('j, U[:,:',ultimox,'], primeras iteraciones')
for j in range(ultimox,-1,-1):
    print(j,u[:,j])

# GRAFICA ------------
import matplotlib.pyplot as plt
tramos = 10
salto = int(n/tramos) # evita muchas líneas
if (salto == 0):
    salto = 1
for j in range(0,n,salto):
    vector = u[:,j]
    plt.plot(xi,vector)
    plt.plot(xi,vector, '.',color='red')
plt.xlabel('x[i]')
plt.ylabel('u[j]')
plt.title('Solución EDP parabólica')
#plt.show()
1.2 Gráficas EDP Parabólica, método explícito en 3D
Esta sección es la base para la generación de las animaciones siguientes, por lo que debe ser incluida antes de las dos siguientes animaciones 2D o 3D. Al menos hasta la parte donde se realiza la transpuesta de U.
# GRAFICA en 3D ------
tj = np.arange(0,n*dt,dt)
tk = np.zeros(tramos,dtype=float)

# Extrae parte de la matriz U,acorde a los tramos
U = np.zeros(shape=(m,tramos),dtype=float)
for k in range(0,tramos,1):
    U[:,k] = u[:,k*salto]
    tk[k] = tj[k*salto]
# Malla para cada eje X,Y
Xi, Yi = np.meshgrid(xi,tk)
U = np.transpose(U)

fig_3D = plt.figure()
graf_3D = fig_3D.add_subplot(111, projection='3d')
graf_3D.plot_wireframe(Xi,Yi,U, color ='blue')
graf_3D.plot(xi[0],tk[1],U[1,0],'o',color ='orange')
graf_3D.plot(xi[1],tk[1],U[1,1],'o',color ='green')
graf_3D.plot(xi[2],tk[1],U[1,2],'o',color ='green')
graf_3D.plot(xi[1],tk[2],U[2,1],'o',color ='salmon',
             label='U[i,j+1]')
graf_3D.set_title('EDP Parabólica')
graf_3D.set_xlabel('x')
graf_3D.set_ylabel('t')
graf_3D.set_zlabel('U')
graf_3D.legend()
graf_3D.view_init(35, -45)
plt.show()
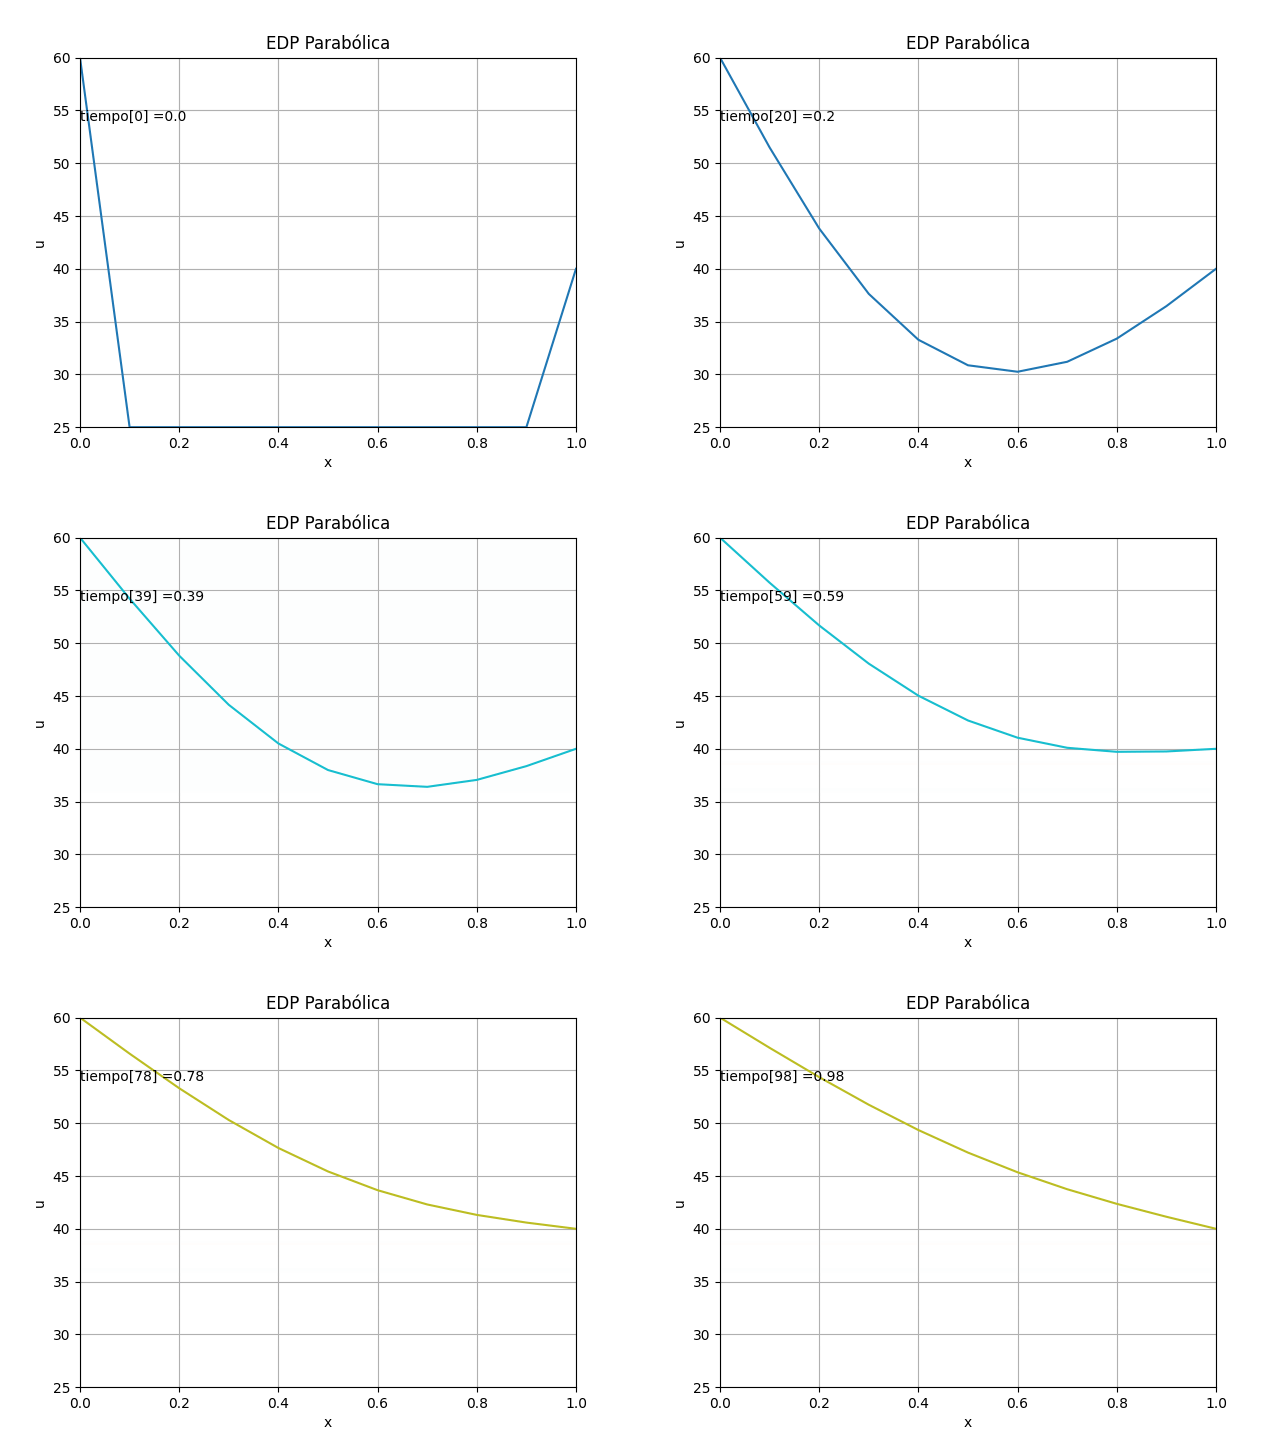
1.3 Gráficas EDP Parabólica, método explícito en 2D con animación
La animación en 2D para la EDP parabólica método explícito se añade, luego de comentar el #plt.show() anterior
# GRAFICA CON ANIMACION 2D--------
# import matplotlib.pyplot as plt
import matplotlib.animation as animation
unmetodo = 'EDP Parabólica - Método explícito'
narchivo = 'EdpParabolica' # nombre archivo GIF

# Parametros de trama/foto
retardo = 500   # milisegundos entre tramas

# GRAFICA animada en fig_ani
fig_ani, graf_ani = plt.subplots()

# Lineas y puntos base
linea_f, = graf_ani.plot(xi,u[:,0])
graf_ani.axhline(0, color='k')  # Eje en x=0

maximoy = np.max(u)
txt_y = maximoy*(1-0.1)
txt_f = graf_ani.text(xi[0],txt_y,'tiempo:',
                      horizontalalignment='left')

# Configura gráfica
graf_ani.set_xlim([xi[0],xi[ultimox]])
graf_ani.set_ylim([ np.min(u),maximoy])
graf_ani.set_title(unmetodo)
graf_ani.set_xlabel('x')
graf_ani.set_ylabel('u')
#graf_ani.legend()
graf_ani.grid()

# Nueva Trama
def unatrama(i,xi,u):
    # actualiza cada linea
    linea_f.set_ydata(u[:,i])
    linea_f.set_xdata(xi)
    linea_f.set_label('tiempo linea: '+str(i))
    if (i<=9): # color de la línea
        lineacolor = 'C'+str(i)
    else:
        numcolor = i%10
        lineacolor = 'C'+str(numcolor)
    linea_f.set_color(lineacolor)
    txt_f.set_text('tiempo['+str(i)+'] = ' + str(i*dt))
    return linea_f, txt_f,

# Limpia Trama anterior
def limpiatrama():
    linea_f.set_ydata(np.ma.array(xi, mask=True))
    linea_f.set_label('')
    txt_f.set_text('')
    return linea_f, txt_f,

# contador de tramas
i = np.arange(0,len(tk),1)
ani = animation.FuncAnimation(fig_ani, unatrama,
                              i ,
                              fargs=(xi,u),
                              init_func=limpiatrama,
                              interval=retardo,
                              blit=True)
# Graba Archivo GIFAnimado y video
ani.save(narchivo+'_animado.gif', writer='imagemagick')
#ani.save(narchivo+'.mp4')
plt.draw()
plt.show()
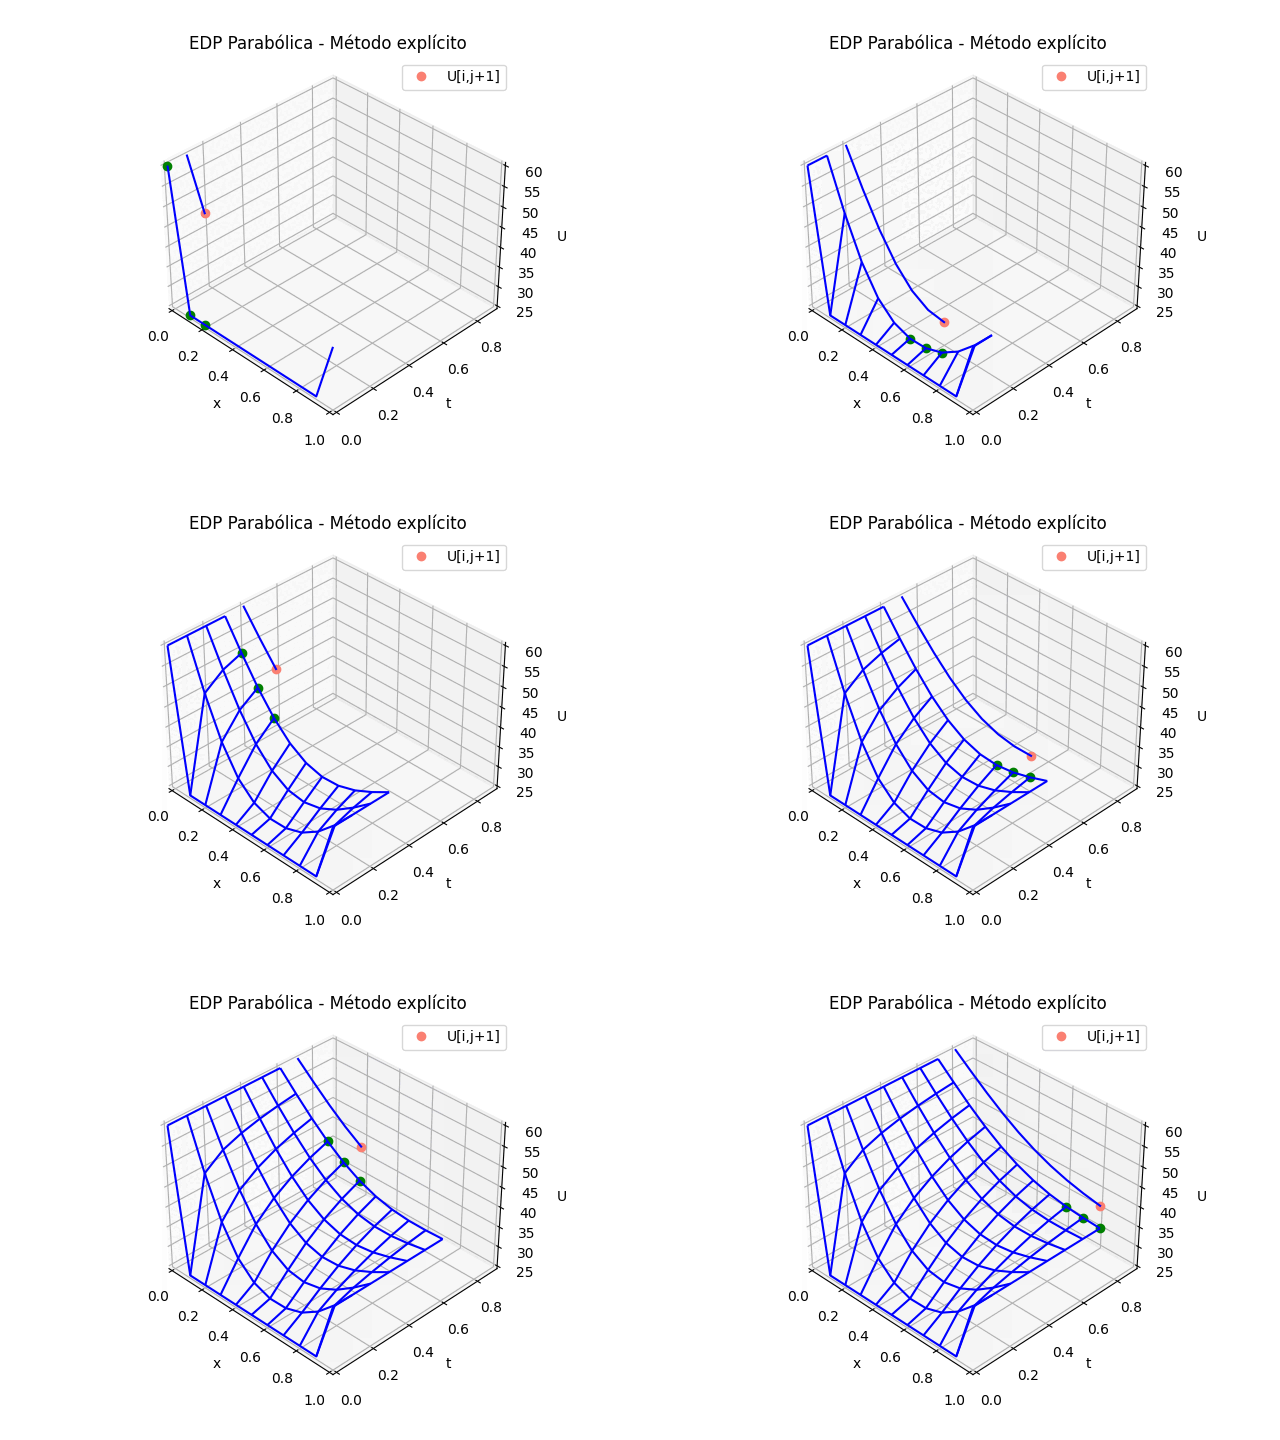
1.4 Gráficas EDP Parabólica, método explícito en 3D con animación
Para el caso de animación 3D, se cambia la sección de animación del algoritmo anterior por:
# GRAFICA CON ANIMACION 3D--------
# import matplotlib.pyplot as plt
import matplotlib.animation as animation
unmetodo = 'EDP Parabólica - Método explícito'
narchivo = 'EdpParabolica2' # nombre archivo GIF

# Parametros de trama/foto
retardo = 500   # milisegundos entre tramas

# GRAFICA animada en fig_ani
fig_ani3D = plt.figure()
graf_ani3 = fig_ani3D.add_subplot(projection='3d')

# Lineas y puntos base
##graf_ani3.plot_wireframe(Xi,Yi,U,
##                         color ='blue',label='EDP Parabólica')
punto_a, = graf_ani3.plot(xi[0],tk[0],U[1,0],'o',color ='green')
punto_b, = graf_ani3.plot(xi[0],tk[0],U[1,0],'o',
                          color ='salmon',label='U[i,j+1]')
linea_c, = graf_ani3.plot(xi[0],tk[0],U[1,0],'-',color ='blue')
# Configura gráfica
graf_ani3.set_xlim(min(xi),max(xi))
graf_ani3.set_ylim(min(tk),max(tk))
graf_ani3.set_title(unmetodo)
graf_ani3.set_xlabel('x')
graf_ani3.set_ylabel('t')
graf_ani3.set_zlabel('U')
graf_ani3.legend()
graf_ani3.grid()
graf_ani3.view_init(35, -45)

mallaEDP = None
# Nueva Trama
def unatrama(i,xi,tk,U,k):
    f = i//k
    c = i%k
    # actualiza cada punto
    punto_a.set_data([[xi[c],xi[c+1],xi[c+2]],
                      [tk[f],tk[f],tk[f]]])
    punto_a.set_3d_properties([U[f,c],U[f,c+1],U[f,c+2]])
    punto_b.set_data([xi[c+1]],[tk[f+1]])
    punto_b.set_3d_properties([U[f+1,c+1]])
    linea_c.set_data(xi[0:c+2],[tk[f+1]]*(c+2))
    linea_c.set_3d_properties([U[f+1,0:c+2]])

    global mallaEDP
    if mallaEDP:
        graf_ani3.collections.remove(mallaEDP)
    mallaEDP = graf_ani3.plot_wireframe(Xi[0:f+1,:],
                                        Yi[0:f+1,:],
                                        U[0:f+1,:],
                                        color ='blue',
                                        label='EDP Parabólica')
    return (punto_a,punto_b,linea_c)


# contador de tramas
k = len(xi)-2
k2 = k*(len(tk)-1)
i = np.arange(0,k2,1)
ani = animation.FuncAnimation(fig_ani3D, unatrama,
                              i ,
                              fargs=(xi,tk,U,k),
                              interval=retardo,
                              blit=False)
# Graba Archivo GIFAnimado y video
ani.save(narchivo+'_animado.gif', writer='imagemagick')
#ani.save(narchivo+'.mp4')
#plt.draw()
plt.show()
EDP Parabólica [ concepto ] [ ejercicio ]
2. EDP Parabólicas método implícito
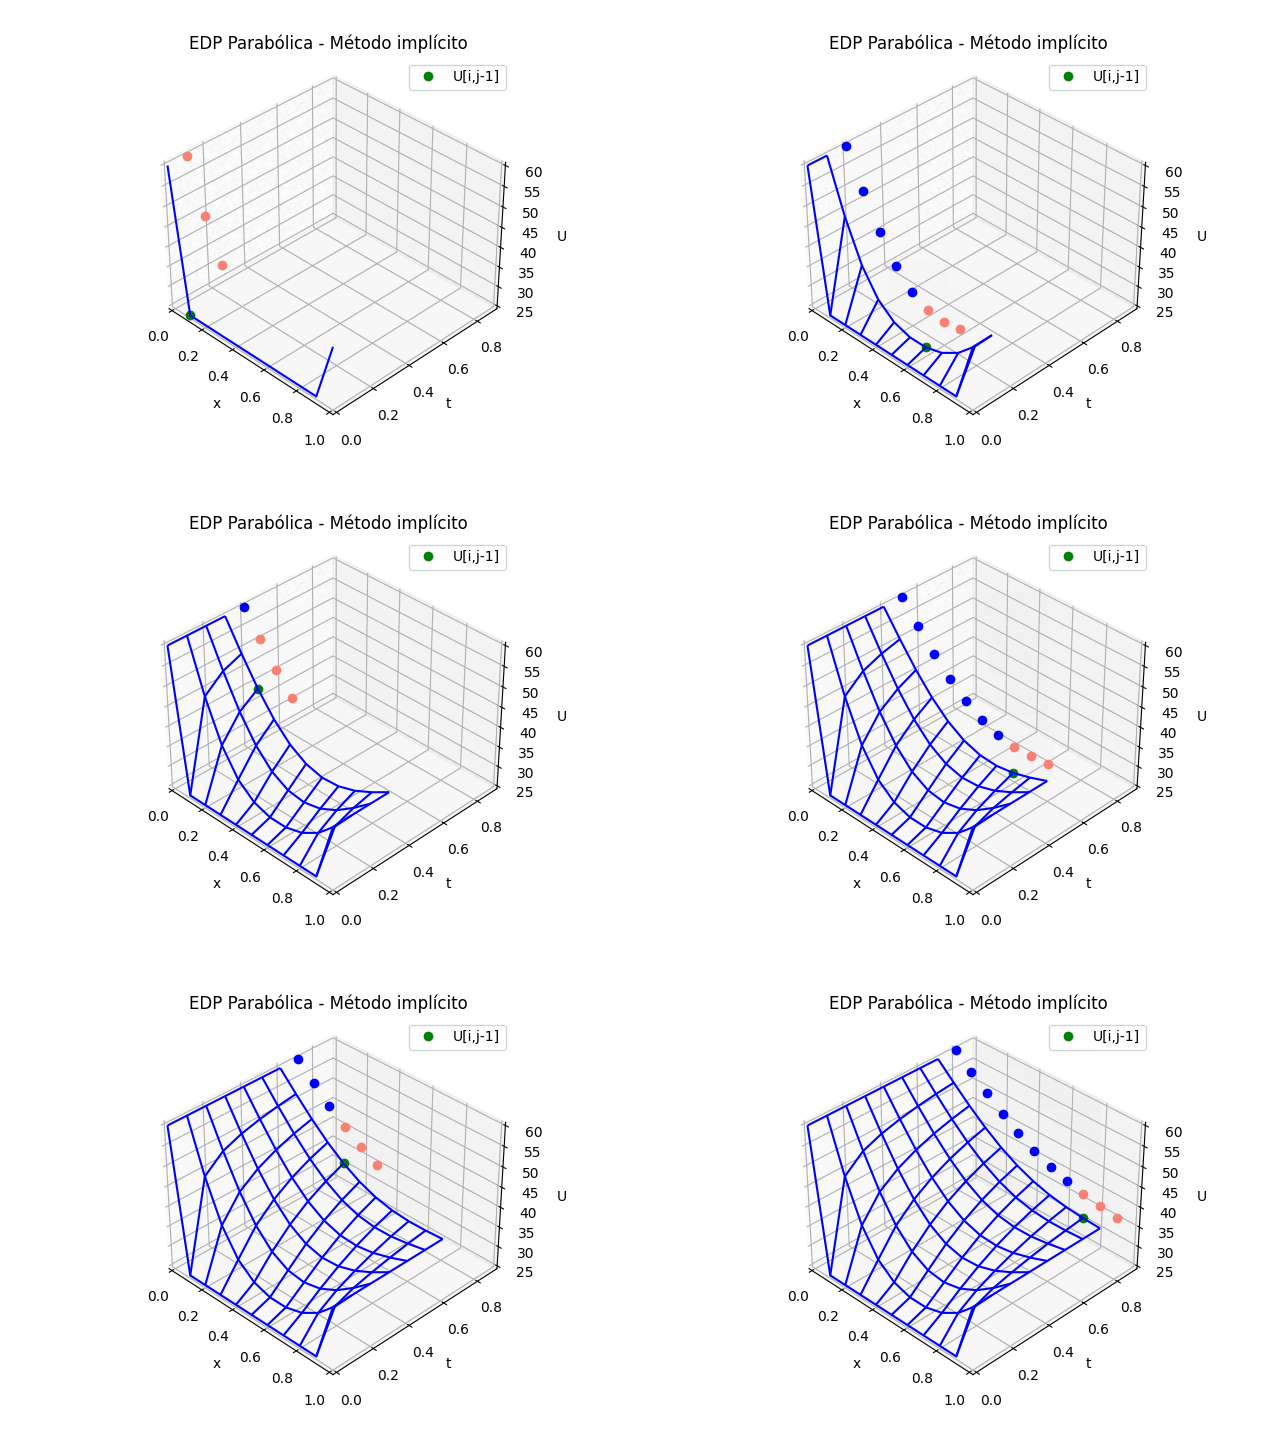
Puesto que la solución de la tabla de resultados en U es la misma que el los dos métodos explícito e implícito, solo se adjunta la parte de la animación.
Para el caso del la gráfica 3D del método implícito se cambia la sección de gráfica animada por:
# GRAFICA CON ANIMACION 3D--------
# import matplotlib.pyplot as plt
import matplotlib.animation as animation
unmetodo = 'EDP Parabólica - Método implícito'
narchivo = 'EdpParabImpli' # nombre archivo GIF

# Parametros de trama/foto
retardo = 500   # milisegundos entre tramas

# GRAFICA animada en fig_ani
fig_ani3D = plt.figure()
graf_ani3 = fig_ani3D.add_subplot(projection='3d')

# Lineas y puntos base
##graf_ani3.plot_wireframe(Xi,Yi,U,
##                         color ='blue',label='EDP Parabólica')
punto_a, = graf_ani3.plot(xi[0],tk[0],U[1,0],'o',color ='salmon')
punto_b, = graf_ani3.plot(xi[0],tk[0],U[1,0],'o',
                          color ='green',label='U[i,j-1]')
linea_c, = graf_ani3.plot(xi[0],tk[0],U[1,0],'o',color ='blue')
# Configura gráfica
graf_ani3.set_xlim(min(xi),max(xi))
graf_ani3.set_ylim(min(tk),max(tk))
graf_ani3.set_title(unmetodo)
graf_ani3.set_xlabel('x')
graf_ani3.set_ylabel('t')
graf_ani3.set_zlabel('U')
graf_ani3.legend()
graf_ani3.grid()
graf_ani3.view_init(35, -45)

mallaEDP = None
# Nueva Trama
def unatrama(i,xi,tk,U,k):
    f = i//k
    c = i%k
    # actualiza cada punto
    punto_a.set_data([[xi[c],xi[c+1],xi[c+2]],
                      [tk[f+1],tk[f+1],tk[f+1]]])
    punto_a.set_3d_properties([U[f+1,c],U[f+1,c+1],U[f+1,c+2]])
    punto_b.set_data([xi[c+1]],[tk[f]])
    punto_b.set_3d_properties([U[f,c+1]])
    linea_c.set_data(xi[0:c],[tk[f+1]]*(c))
    linea_c.set_3d_properties([U[f+1,0:c]])

    global mallaEDP
    if mallaEDP:
        graf_ani3.collections.remove(mallaEDP)
    mallaEDP = graf_ani3.plot_wireframe(Xi[0:f+1,:],
                                        Yi[0:f+1,:],
                                        U[0:f+1,:],
                                        color ='blue',
                                        label='EDP Parabólica')
    return (punto_a,punto_b,linea_c)


# contador de tramas
k = len(xi)-2
k2 = k*(len(tk)-1)
i = np.arange(0,k2,1)
ani = animation.FuncAnimation(fig_ani3D, unatrama,
                              i ,
                              fargs=(xi,tk,U,k),
                              interval=retardo,
                              blit=False)
# Graba Archivo GIFAnimado y video
ani.save(narchivo+'_animado.gif', writer='imagemagick')
#ani.save(narchivo+'.mp4')
#plt.draw()
plt.show()
EDP Parabólica [ concepto ] [ ejercicio ]
2. EDP Elípticas método iterativo
Al algoritmo desarrollado en EDP Elípticas método iterativo, se crean una lista para almacenar los valores de la matriz U por cada iteración, se usan para graficar cada iteración.
# Ecuaciones Diferenciales Parciales
# Elipticas. Método iterativo
import numpy as np

# INGRESO
# Condiciones iniciales en los bordes
Ta = 60     # izquierda
Tb = 25     # derecha
#Tc = 50    # inferior
fxc = lambda x: 50+0*x # función inicial inferior
# Td = 70   # superior
fxd = lambda x: 70+0*x # función inicial superior

# dimensiones de la placa
x0 = 0    # longitud en x
xn = 2
y0 = 0    # longitud en y
yn = 1.5
# discretiza, supone dx=dy
dx = 0.25  # Tamaño de paso
dy = dx
iteramax = 100
tolera = 0.0001
verdigitos = 2   # decimales a mostrar en tabla de resultados

# PROCEDIMIENTO
xi = np.arange(x0,xn+dx,dx)
yj = np.arange(y0,yn+dy,dy)
n = len(xi)
m = len(yj)

# Matriz u
u = np.zeros(shape=(n,m),dtype = float)
# llena u con valores en fronteras
u[0,:]   = Ta       # izquierda
u[n-1,:] = Tb       # derecha
fic = fxc(xi)
u[:,0]   = fic  # Tc inferior
fid = fxd(xi)
u[:,m-1] = fid  # Td superior
# valor inicial de iteración dentro de u
# promedio = (Ta+Tb+Tc+Td)/4
promedio = (Ta+Tb+np.max(fic)+np.max(fid))/4
u[1:n-1,1:m-1] = promedio
np.set_printoptions(precision=verdigitos)
print('u inicial:')
print(np.transpose(u))

# iterar puntos interiores
U_3D = [np.copy(u)]
U_error = ['--']
itera = 0
converge = False
while (itera<=iteramax and converge==False):
    itera = itera +1
    Uantes = np.copy(u)
    for i in range(1,n-1):
        for j in range(1,m-1):
            u[i,j] = (u[i-1,j]+u[i+1,j]+u[i,j-1]+u[i,j+1])/4
    diferencia = u - Uantes
    errado_u = np.max(np.abs(diferencia))
    if (errado_u<tolera):
        converge=True
    U_3D.append(np.copy(u))
    U_error.append(np.around(errado_u,verdigitos))
    if itera<=3:
        np.set_printoptions(precision=verdigitos)
        print('itera:',itera-1,'  ; ','u:')
        print(np.transpose(u))
        print('errado_u: ', errado_u)
    if itera==4:
        print('... continua')

# SALIDA
print('Método Iterativo EDP Elíptica')
print('iteraciones:',itera,' converge = ', converge)
print('xi:', xi)
print('yj:', yj)
print('Tabla de resultados en malla EDP Elíptica')
print('j, U[i,j]')
for j in range(m-1,-1,-1):
    print(j,u[:,j])

# GRAFICA en 3D ------
import matplotlib.pyplot as plt
# Malla para cada eje X,Y
Xi, Yi = np.meshgrid(xi, yj)
U = np.transpose(u) # ajuste de índices fila es x

fig_3D = plt.figure()
graf_3D = fig_3D.add_subplot(111, projection='3d')
graf_3D.plot_wireframe(Xi,Yi,U,
                       color ='blue')
graf_3D.plot(Xi[1,0],Yi[1,0],U[1,0],'o',color ='orange')
graf_3D.plot(Xi[1,1],Yi[1,1],U[1,1],'o',color ='red',
             label='U[i,j]')
graf_3D.plot(Xi[1,2],Yi[1,2],U[1,2],'o',color ='salmon')
graf_3D.plot(Xi[0,1],Yi[0,1],U[0,1],'o',color ='green')
graf_3D.plot(Xi[2,1],Yi[2,1],U[2,1],'o',color ='salmon')

graf_3D.set_title('EDP elíptica')
graf_3D.set_xlabel('x')
graf_3D.set_ylabel('y')
graf_3D.set_zlabel('U')
graf_3D.legend()
graf_3D.view_init(35, -45)
plt.show()

# GRAFICA CON ANIMACION 3D--------
# import matplotlib.pyplot as plt
import matplotlib.animation as animation
unmetodo = 'EDP Eliptica - Método iterativo'
narchivo = 'EdpElipticaItera' # nombre archivo GIF

# Parametros de trama/foto
retardo = 500   # milisegundos entre tramas

# GRAFICA animada en fig_ani
fig_ani3D = plt.figure()
graf_ani3 = fig_ani3D.add_subplot(projection='3d')

# Lineas y puntos base
punto_a, = graf_ani3.plot(xi[0],yj[0],U[0,0],'.',color ='blue')

# Configura gráfica
graf_ani3.set_xlim(min(xi),max(xi))
graf_ani3.set_ylim(min(yj),max(yj))
graf_ani3.set_title(unmetodo)
graf_ani3.set_xlabel('x')
graf_ani3.set_ylabel('t')
graf_ani3.set_zlabel('U')
# graf_ani3.legend()
graf_ani3.grid()
graf_ani3.view_init(35, -45)

etiqueta_i ='itera: '+str(0)
etiqueta_err = 'errado['+str(0)+']: '+str(U_error[0])
txt_i = graf_ani3.text2D(0.05, 0.95, etiqueta_i,
                         transform=graf_ani3.transAxes)
txt_errado = graf_ani3.text2D(0.05, 0.90, etiqueta_err,
                              transform=graf_ani3.transAxes)

mallaEDP = None
# Nueva Trama
def unatrama(i,xi,yj,U_3D,U_error):

    etiqueta_i ='itera: '+str(i)
    txt_i.set_text(etiqueta_i)
    etiqueta_err = 'errado['+str(i)+']: '+str(U_error[i])
    txt_errado.set_text(etiqueta_err)
    global mallaEDP
    if mallaEDP:
        graf_ani3.collections.remove(mallaEDP)
    mallaEDP = graf_ani3.plot_wireframe(Xi,Yi,
                                        np.transpose(U_3D[i]),
                                        color ='blue')
    return (txt_i,txt_errado,)


# contador de tramas
k = 11 #len(U_3D)
i = np.arange(0,k,1)
ani = animation.FuncAnimation(fig_ani3D, unatrama,
                              i ,
                              fargs=(xi,yj,U_3D,U_error),
                              interval=retardo,
                              blit=False)
# Graba Archivo GIFAnimado y video
ani.save(narchivo+'_animado.gif', writer='imagemagick')
#ani.save(narchivo+'.mp4')
#plt.draw()
plt.show()
