Ejercicio: 2Eva_IIT2016_T3_MN EDO Taylor 2, Tanque de agua
La solución obtenida se realiza con h=0.5 y usando dos métodos para comparar resultados.
\frac{dy}{dt} = -k \sqrt{y}1. EDO con Taylor
Usando una aproximación con dos términos de Taylor:
y_{i+1}=y_{i}+ y'_{i} h+\frac{y"_{i}}{2}h^{2}Por lo que se obtienen las derivadas necesarias:
y'_i= -k (y_i)^{1/2} y"_i= \frac{-k}{2}(y_i)^{-1/2}1.1 iteraciones
i=0, y0=3, t0=0
y'_0= -k(y_0)^{1/2} =-0.06(3)^{1/2} = -0.1039 y"_0= \frac{-0.06}{2}(3)^{-1/2} = -0.0173 y_{1}=y_{0}+ y'_{0} (1)+\frac{y"_{0}}{2}(1)^{2} y_{1}=3+ (-0.1039) (0.5)+\frac{-0.0173}{2}(0.5)^{2}= 2.9458t1=t0+h = 0+0.5= 0.5
i=1, y1=2.9458, t1=0.5
y'_1= -k(y_1)^{1/2} =-0.06(2.887)^{1/2} =-0.1029 y"_1= \frac{-0.06}{2}(2.887)^{-1/2} = -0.0174 y_{2}=y_{1}+ y'_{1} (1)+\frac{y"_{1}}{2}(1)^{2} y_{1}=2.9458+ (-0.1029) (1)+\frac{-0.0174}{2}(1)^{2}= 2.8921t2=t1+h = 0.5+0.5 = 1.0
i=2, y2=2.8921, t2=1.0
Resolver como Tarea
1.2 Resultados con Python
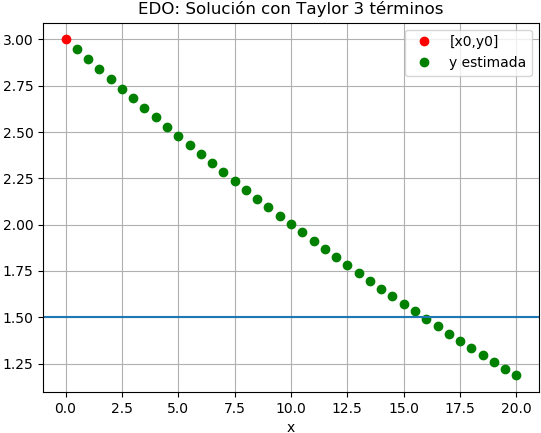
Realizando una tabla de valores usando Python y una gráfica, encuentra que el valor buscado del tanque a la mitad se obtiene en 16 minutos.
estimado[xi,yi]
[[ 0.          3.        ]
 [ 0.5         2.94587341]
 [ 1.          2.89219791]
 [ 1.5         2.83897347]
 [ 2.          2.7862001 ]
 ...
 [14.          1.65488507]
 [14.5         1.61337731]
 [15.          1.57231935]
 [15.5         1.53171109]
 [16.          1.49155239]
 [16.5         1.45184313]
 [17.          1.41258317]
 [17.5         1.37377234]
 [18.          1.33541049]
 [18.5         1.29749744]
 [19.          1.26003297]
 [19.5         1.22301689]
 [20.          1.18644897]]
Algoritmo en Python para Solución EDO con tres términos:
# EDO. Método de Taylor 3 términos
# estima la solucion para muestras espaciadas h en eje x
# valores iniciales x0,y0
# entrega arreglo [[x,y]]
import numpy as np

def edo_taylor3t(d1y,d2y,x0,y0,h,muestras):
    tamano = muestras + 1
    estimado = np.zeros(shape=(tamano,2),dtype=float)
    # incluye el punto [x0,y0]
    estimado[0] = [x0,y0]
    x = x0
    y = y0
    for i in range(1,tamano,1):
        y = y + h*d1y(x,y) + ((h**2)/2)*d2y(x,y)
        x = x+h
        estimado[i] = [x,y]
    return(estimado)

# PROGRAMA PRUEBA
# 2Eva_IIT2016_T3_MN EDO Taylor 2, Tanque de agua

# INGRESO.
k=0.06
# d1y = y' = f, d2y = y'' = f'
d1y = lambda x,y: -k*(y**0.5)
d2y = lambda x,y: -(k/2)*(y**(-0.5))
x0 = 0
y0 = 3
h = 1/2
muestras = 40

# PROCEDIMIENTO
puntos = edo_taylor3t(d1y,d2y,x0,y0,h,muestras)
xi = puntos[:,0]
yi = puntos[:,1]

# SALIDA
print('estimado[xi,yi]')
print(puntos)
# Gráfica
import matplotlib.pyplot as plt
plt.plot(xi[0],yi[0],'o', color='r', label ='[x0,y0]')
plt.plot(xi[1:],yi[1:],'o', color='g', label ='y estimada')
plt.axhline(y0/2)
plt.title('EDO: Solución con Taylor 3 términos')
plt.xlabel('x')
plt.ylabel('y')
plt.legend()
plt.grid()
plt.show()
2. EDO con Runge-Kutta de 2do Orden dy/dx
Para éste método no se requiere desarrollar la segunda derivada, se usa el mismo h =0.5 con fines de comparación de resultados
2.1 ITeraciones
i = 1, y0=3, t0=0
K_1 = h y'(x_0,y_0) = (0.5)*(-0.06)(3)^{1/2} =-0.05196 K_2 = h y'(x_0+h,y_0+K_1) = (0.5)* y'(0.5,3-0.05196) = -0.05150 y_1 = y_0+\frac{K1+K2}{2} = 3+\frac{-0.05196-0.05150}{2} = 2.9482i = 2, y1=2.9482, t1=0.5
K_1 = h y'(x_1,y_1) = (0.5)*(-0.06)(2.9482)^{1/2} =-0.05149 K_2 = h y'(x_1+h,y_1+K_1) = (0.5)* y'(0.5,2.9482-0.05149) = -0.05103 y_1 = y_0+\frac{K1+K2}{2} = 3+\frac{-0.05149-0.05103}{2} = -2.8946i = 3, y1=2.8946, t1=1.0
Resolver como Tarea
2.2 Resultados con Python
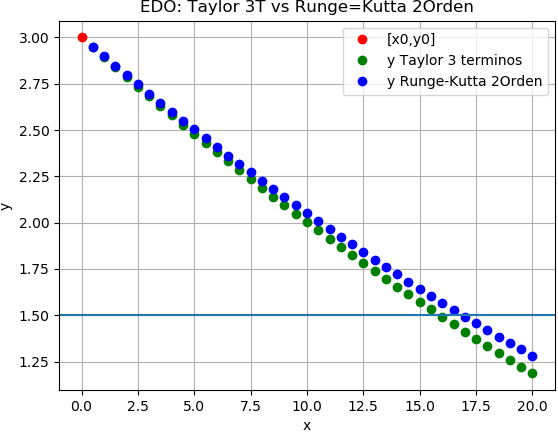
Si comparamos con los resultados anteriores en una tabla, y obteniendo las diferencias entre cada iteración se tiene que:
estimado[xi,yi Taylor, yi Runge-Kutta, diferencias]
[[ 0.0  3.00000000  3.00000000  0.00000000e+00]
 [ 0.5  2.94587341  2.94826446 -2.39104632e-03]
 [ 1.0  2.89219791  2.89697892 -4.78100868e-03]
 [ 1.5  2.83897347  2.84614338 -7.16990106e-03]
 [ 2.0  2.78620010  2.79575783 -9.55773860e-03]
...
 [ 14.0  1.65488507  1.72150488 -6.66198112e-02]
 [ 14.5  1.61337731  1.68236934 -6.89920328e-02]
 [ 15.0  1.57231935  1.64368380 -7.13644510e-02]
 [ 15.5  1.53171109  1.60544826 -7.37371784e-02]
 [ 16.0  1.49155239  1.56766273 -7.61103370e-02]
 [ 16.5  1.45184313  1.53032719 -7.84840585e-02]
 [ 17.0  1.41258317  1.49344165 -8.08584854e-02]
 [ 17.5  1.37377234  1.45700611 -8.32337718e-02]
 [ 18.0  1.33541049  1.42102058 -8.56100848e-02]
 [ 18.5  1.29749744  1.38548504 -8.79876055e-02]
 [ 19.0  1.26003297  1.35039950 -9.03665304e-02]
 [ 19.5  1.22301689  1.31576397 -9.27470733e-02]
 [ 20.0  1.18644897  1.28157843 -9.51294661e-02]]
error en rango:  0.09512946613018003
# EDO. Método de Taylor 3 términos
# estima la solucion para muestras espaciadas h en eje x
# valores iniciales x0,y0
# entrega arreglo [[x,y]]
import numpy as np

def edo_taylor3t(d1y,d2y,x0,y0,h,muestras):
    tamano = muestras + 1
    estimado = np.zeros(shape=(tamano,2),dtype=float)
    # incluye el punto [x0,y0]
    estimado[0] = [x0,y0]
    x = x0
    y = y0
    for i in range(1,tamano,1):
        y = y + h*d1y(x,y) + ((h**2)/2)*d2y(x,y)
        x = x+h
        estimado[i] = [x,y]
    return(estimado)

def rungekutta2(d1y,x0,y0,h,muestras):
    tamano = muestras + 1
    estimado = np.zeros(shape=(tamano,2),dtype=float)
    # incluye el punto [x0,y0]
    estimado[0] = [x0,y0]
    xi = x0
    yi = y0
    for i in range(1,tamano,1):
        K1 = h * d1y(xi,yi)
        K2 = h * d1y(xi+h, yi + K1)

        yi = yi + (K1+K2)/2
        xi = xi + h

        estimado[i] = [xi,yi]
    return(estimado)

# PROGRAMA PRUEBA
# 2Eva_IIT2016_T3_MN EDO Taylor 2, Tanque de agua

# INGRESO.
k=0.06
# d1y = y' = f, d2y = y'' = f'
d1y = lambda x,y: -k*(y**0.5)
d2y = lambda x,y: -(k/2)*(y**(-0.5))
x0 = 0
y0 = 3
h = 1/2
muestras = 40

# PROCEDIMIENTO
puntos = edo_taylor3t(d1y,d2y,x0,y0,h,muestras)
xi = puntos[:,0]
yi = puntos[:,1]

# Con Runge Kutta
puntosRK2 = rungekutta2(d1y,x0,y0,h,muestras)
xiRK2 = puntosRK2[:,0]
yiRK2 = puntosRK2[:,1]

# diferencias
diferencias = yi-yiRK2
error = np.max(np.abs(diferencias))
tabla = np.copy(puntos)
tabla = np.concatenate((puntos,np.transpose([yiRK2]),
                        np.transpose([diferencias])),
                       axis = 1)

# SALIDA
print('estimado[xi,yi Taylor,yi Runge-Kutta,diferencias]')
print(tabla)
print('error en rango: ', error)

# Gráfica
import matplotlib.pyplot as plt
plt.plot(xi[0],yi[0],'o',
         color='r', label ='[x0,y0]')
plt.plot(xi[1:],yi[1:],'o',
         color='g',
         label ='y Taylor 3 terminos')
plt.plot(xiRK2[1:],yiRK2[1:],'o',
         color='blue',
         label ='y Runge-Kutta 2Orden')
plt.axhline(y0/2)
plt.title('EDO: Taylor 3T vs Runge=Kutta 2Orden')
plt.xlabel('x')
plt.ylabel('y')
plt.legend()
plt.grid()
plt.show()


