Ejercicio: 2Eva_IT2015_T2 EDO Deflexión de mástil
\frac{\delta ^2 y}{\delta x^2} = \frac{f}{2EI} (L-x)^2
x= 0, y = 0, \frac{\delta y}{\delta x} = 0
Ecuación en forma estandarizada:
y'' = \frac{f}{2EI} (L-x)^2
Sistema de ecuaciones
y' = z = f(x,y,z)
z' = \frac{f}{2EI} (L-x)^2 = g(x,y,z)
siendo:
\frac{f}{2EI} =\frac{60}{2(1.25 \times 10 ^{-8}) (0.05)} = 4.8 \times 10^{-6}
El mástil mide L=30 m y se requieren 30 intervalos, entonces h = 30/30 = 1.
Usando muestras = tramos +1 = 31
Se plantea una solución usando Runge Kutta de 2do Orden
f(x,y,z) = z
g(x,y,z) = (4.8 \times 10^{-6})(30-x)^2
Desarrollo analítico
Las iteraciones se realizan para llenar los datos de la tabla,
tabla de resultados
| i |
xi |
yi |
zi |
| 0 |
0 |
0 |
0 |
| 1 |
1 |
0.00216 |
0.00417 |
| 2 |
2 |
0.00835 |
0.00807 |
| 3 |
3 |
tarea |
... |
iteración 1
i = 0 ; x0= 0; y0 = 0; z0 = 0
K_{1y} = h f(x_0,y_0, z_0)= 1(0) = 0
K_{1z} = h g(x_0,y_0, z_0) =
= 1(4.8 \times 10^{-6})(30-0)^2 = 0.00432
K_{2y} = h f(x_0+h,y_0+K_{1y}, z_0+K_{1z}) =
= 1(0+0.00432) = 0.00432
K_{2z} = h g(x_0+h,y_0+K_{1y}, z_0+K_{1z}) =
= 1(4.8 \times 10^{-6})(30-(0+1))^2 = 0.00403
y_1 = y_0 + \frac{K_{1y}+K_{2y}}{2} =
= 0 + \frac{0+0.00432}{2} = 0.00216
z_1 = z_0 + \frac{K_{1z}+K_{2z}}{2} =
= 0 + \frac{0.00432+0.00403}{2} = 0.00417
iteración 2
i = 2 ; x1= 1; y1 = 0.00216; z1 = 0.00417
K_{1y} = h f(x_1,y_1, z_1)= 1(0.00417) = 0.00417
K_{1z} = h g(x_1,y_1, z_1) =
= 1(4.8 \times 10^{-6})(30-1)^2 = 0.00403
K_{2y} = h f(x_1+h,y_1+K_{1y}, z_1+K_{1z}) =
= 1(0.00417+0.00403) = 0.00821
K_{2z} = h g(x_1+h,y_1+K_{1y}, z_1+K_{1z}) =
= 1(4.8 \times 10^{-6})(30-(1+1))^2 = 0.00376
y_2 = y_1 + \frac{K_{1y}+K_{2y}}{2} =
= 0.00216 + \frac{0.00417+0.00821}{2} = 0.00835
z_2 = z_2 + \frac{K_{1z}+K_{2z}}{2} =
= 0.00417 + \frac{0.00403+0.00376}{2} = 0.00807
iteración 3
i = 2; x2= 2; y2 = 0.00835; z2 = 0.00807
tarea ...
Para facilitar los cálculos se propone usa el algoritmo en Python, como se describe en la siguiente sección.
Algoritmo en Python
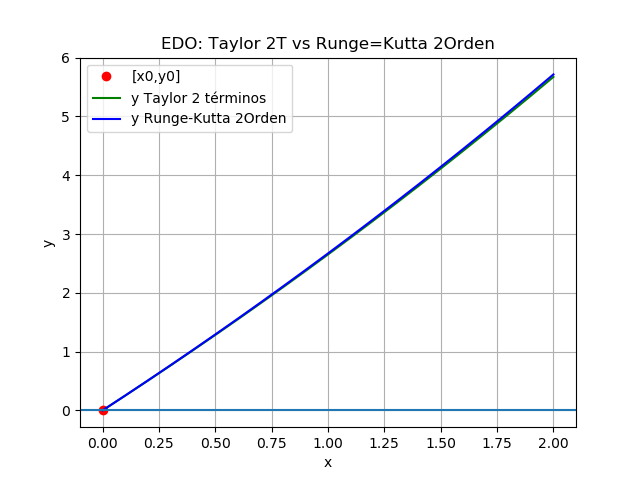
Al usar el algoritmo se puede comparar los resultados entre Runge-Kutta de 2do orden y de 4to Orden.
De los resultados se presenta la siguiente gráfica
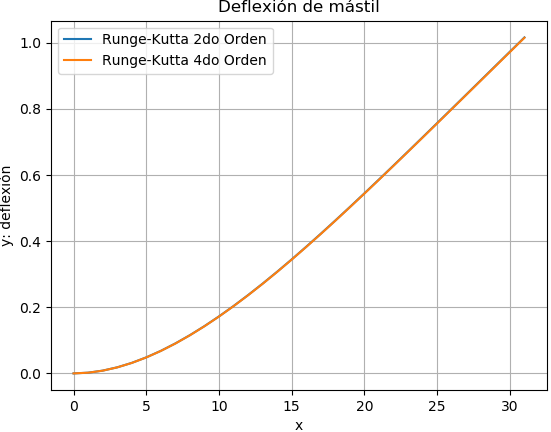
Observe en la gráfica la diferencia de escalas entre los ejes.
Runge Kutta 2do Orden
 [x, y, z]
[[  0.00000000e+00   0.00000000e+00   0.00000000e+00]
 [  1.00000000e+00   2.16000000e-03   4.17840000e-03]
 [  2.00000000e+00   8.35680000e-03   8.07840000e-03]
 [  3.00000000e+00   1.83168000e-02   1.17096000e-02]
 [  4.00000000e+00   3.17760000e-02   1.50816000e-02]
 [  5.00000000e+00   4.84800000e-02   1.82040000e-02]
 ...
 [  2.90000000e+01   9.29856000e-01   4.32216000e-02]
 [  3.00000000e+01   9.73080000e-01   4.32240000e-02]
 [  3.10000000e+01   1.01630400e+00   4.32264000e-02]]
Runge Kutta 4do Orden
 [x, y, z]
[[  0.00000000e+00   0.00000000e+00   0.00000000e+00]
 [  1.00000000e+00   2.11240000e-03   4.17760000e-03]
 [  2.00000000e+00   8.26240000e-03   8.07680000e-03]
 [  3.00000000e+00   1.81764000e-02   1.17072000e-02]
 [  4.00000000e+00   3.15904000e-02   1.50784000e-02]
 [  5.00000000e+00   4.82500000e-02   1.82000000e-02]
 ...
 [  2.90000000e+01   9.28800400e-01   4.31984000e-02]
 [  3.00000000e+01   9.72000000e-01   4.32000000e-02]
 [  3.10000000e+01   1.01520040e+00   4.32016000e-02]]
>>>
Las instrucciones en Python obtener los resultados:
# 2Eva_IT2015_T2 Deflexión de mástil
# solución propuesta: edelros@espol.edu.ec
import numpy as np

def rungekutta2fg(fx,gx,x0,y0,z0,h,muestras):
    tamano = muestras + 1
    estimado = np.zeros(shape=(tamano,3),dtype=float)
    # incluye el punto [x0,y0]
    estimado[0] = [x0,y0,z0]
    xi = x0
    yi = y0
    zi = z0
    for i in range(1,tamano,1):
        K1y = h * fx(xi,yi,zi)
        K1z = h * gx(xi,yi,zi)

        K2y = h * fx(xi+h, yi + K1y, zi + K1z)
        K2z = h * gx(xi+h, yi + K1y, zi + K1z)

        yi = yi + (K1y+K2y)/2
        zi = zi + (K1z+K2z)/2
        xi = xi + h

        estimado[i] = [xi,yi,zi]
    return(estimado)

def rungekutta4fg(fx,gx,x0,y0,z0,h,muestras):
    tamano = muestras + 1
    estimado = np.zeros(shape=(tamano,3),dtype=float)
    # incluye el punto [x0,y0]
    estimado[0] = [x0,y0,z0]
    xi = x0
    yi = y0
    zi = z0
    for i in range(1,tamano,1):
        K1y = h * fx(xi,yi,zi)
        K1z = h * gx(xi,yi,zi)

        K2y = h * fx(xi+h/2, yi + K1y/2, zi + K1z/2)
        K2z = h * gx(xi+h/2, yi + K1y/2, zi + K1z/2)

        K3y = h * fx(xi+h/2, yi + K2y/2, zi + K2z/2)
        K3z = h * gx(xi+h/2, yi + K2y/2, zi + K2z/2)

        K4y = h * fx(xi+h, yi + K3y, zi + K3z)
        K4z = h * gx(xi+h, yi + K3y, zi + K3z)

        yi = yi + (K1y+2*K2y+2*K3y+K4y)/6
        zi = zi + (K1z+2*K2z+2*K3z+K4z)/6
        xi = xi + h

        estimado[i] = [xi,yi,zi]
    return(estimado)

# INGRESO
f = 60
L = 30
E = 1.25e8
I = 0.05
x0 = 0
y0 = 0
z0 = 0
tramos = 30

fx = lambda x,y,z: z
gx = lambda x,y,z: (f/(2*E*I))*(L-x)**2

# PROCEDIMIENTO
muestras = tramos + 1
h = L/tramos
tabla2 = rungekutta2fg(fx,gx,x0,y0,z0,h,muestras)
xi2 = tabla2[:,0]
yi2 = tabla2[:,1]
zi2 = tabla2[:,2]

tabla4 = rungekutta4fg(fx,gx,x0,y0,z0,h,muestras)
xi4 = tabla4[:,0]
yi4 = tabla4[:,1]
zi4 = tabla4[:,2]

# SALIDA
print('Runge Kutta 2do Orden')
print(' [x, y, z]')
print(tabla2)
print('Runge Kutta 4do Orden')
print(' [x, y, z]')
print(tabla4)

# GRAFICA
import matplotlib.pyplot as plt
plt.plot(xi2,yi2, label='Runge-Kutta 2do Orden')
plt.plot(xi4,yi4, label='Runge-Kutta 4do Orden')
plt.title('Deflexión de mástil')
plt.xlabel('x')
plt.ylabel('y: deflexión')
plt.legend()
plt.grid()
plt.show()

